TextViz is a web-based tool that allows users to analyze and visualize their text data using natural language processing (NLP) and artificial intelligence (AI). Users can upload or paste their text data, choose from various NLP models and visualization charts, and get instant insights and reports. TextViz aims to empower decision-makers, researchers, and anyone who works with text data to gain a deeper understanding of their data and communicate their findings effectively.
Text data is everywhere: social media posts, customer reviews, news articles, research papers, etc. However, text data is often unstructured, messy, and hard to interpret. Moreover, traditional data analysis and visualization tools are not designed for text data and require a lot of manual work and technical skills.
TextViz solves this problem by providing a user-friendly and powerful tool that can handle any type of text data and generate meaningful visualizations and insights. TextViz leverages the power of AI and NLP to process, analyze, and transform text data into interactive and engaging charts. Users can easily explore their data, discover patterns, trends, and insights, and export their results in PDF format.
The process of designing TextViz involved the following steps:
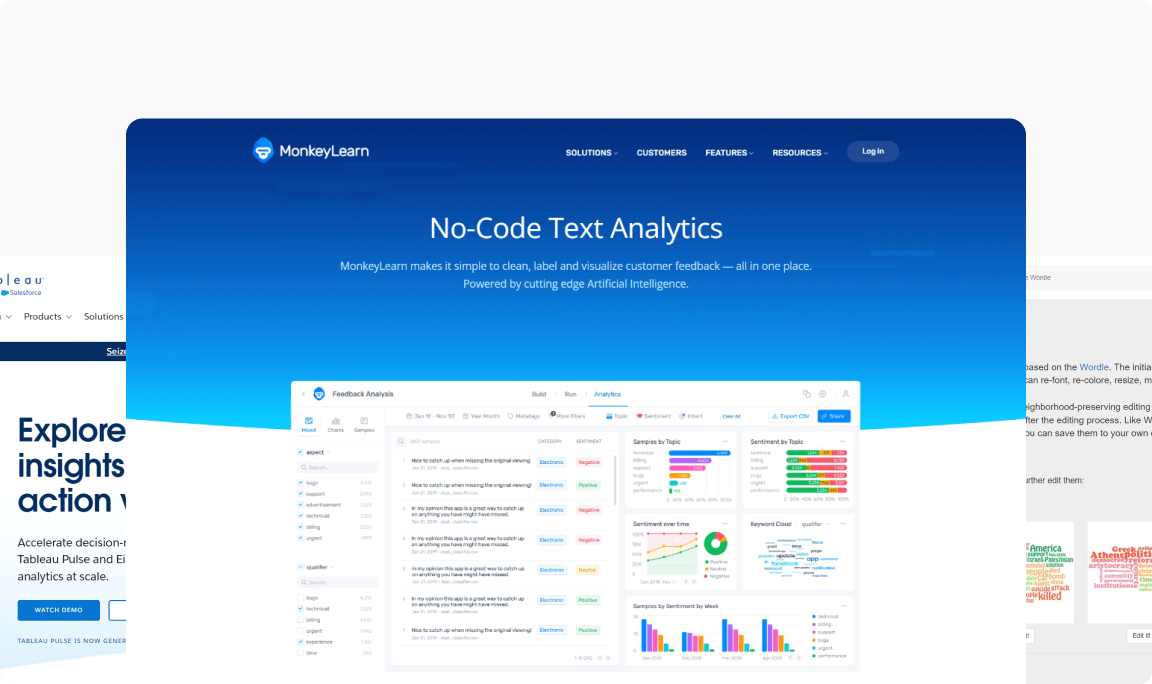
The first step was to conduct market research and competitor analysis to understand the current landscape of text data analysis and visualization tools. Some of the existing tools that were reviewed include:
Wordle: A simple tool that generates word clouds from text data.
MonkeyLearn: A cloud-based platform that offers various NLP services such as sentiment analysis, topic modeling, keyword extraction, etc.
Tableau: A popular data visualization software that can also handle text data with some limitations and customization.
The research revealed that there is a gap in the market for a tool that can offer both NLP and data visualization capabilities in an easy and accessible way. Moreover, the research also identified some of the common pain points and needs of potential users, such as:
Lack of time and resources to analyze and visualize text data
Difficulty in finding the right NLP model and visualization chart for their data
Lack of trust and transparency in the AI and NLP processes
Difficulty in sharing and presenting their results
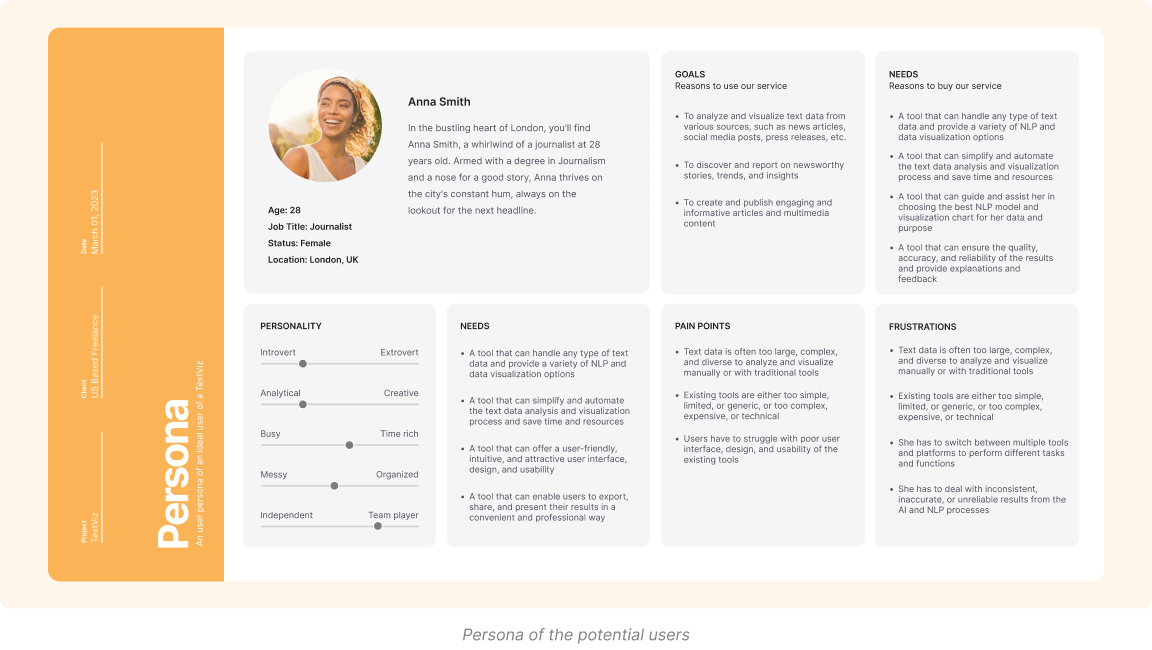
The next step was to conduct user interviews with potential users of TxtViz, such as data analysts, researchers, marketers, journalists, etc. The goal of the user interviews was to validate the assumptions, pain points, and needs that were identified in the research phase.
“I need a tool that can help me analyze and visualize text data quickly and easily, and provide me with meaningful and actionable insights.”
The ideation phase involved generating and evaluating various ideas and concepts for TextViz, using different techniques such as brainstorming and worst possible idea.
Brainstorming is a technique that involves generating as many ideas as possible without judging or filtering them. Some of the brainstorming ideas that were generated for TextViz include:
A tool that can create interactive and animated data visualizations that can be embedded in websites or social media platforms
Tool that can use voice recognition and natural language generation to analyze and visualize text data using voice commands and responses
A tool that can use augmented reality and virtual reality to create immersive and realistic data visualizations that can be experienced in 3D
Worst possible idea is a technique that involves generating the worst, most absurd, or most ridiculous ideas possible. The goal is to challenge the assumptions, constraints, and expectations and to generate humor and fun. Some of the worst possible ideas that were generated for TxtViz include:
A tool that can only create word clouds from text data and nothing else
A tool that can randomly choose an NLP model and a visualization chart for the text data without any logic or reason
The design phase involved creating high-fidelity prototypes for TxtViz, based on the best ideas and concepts that were selected from the ideation phase.
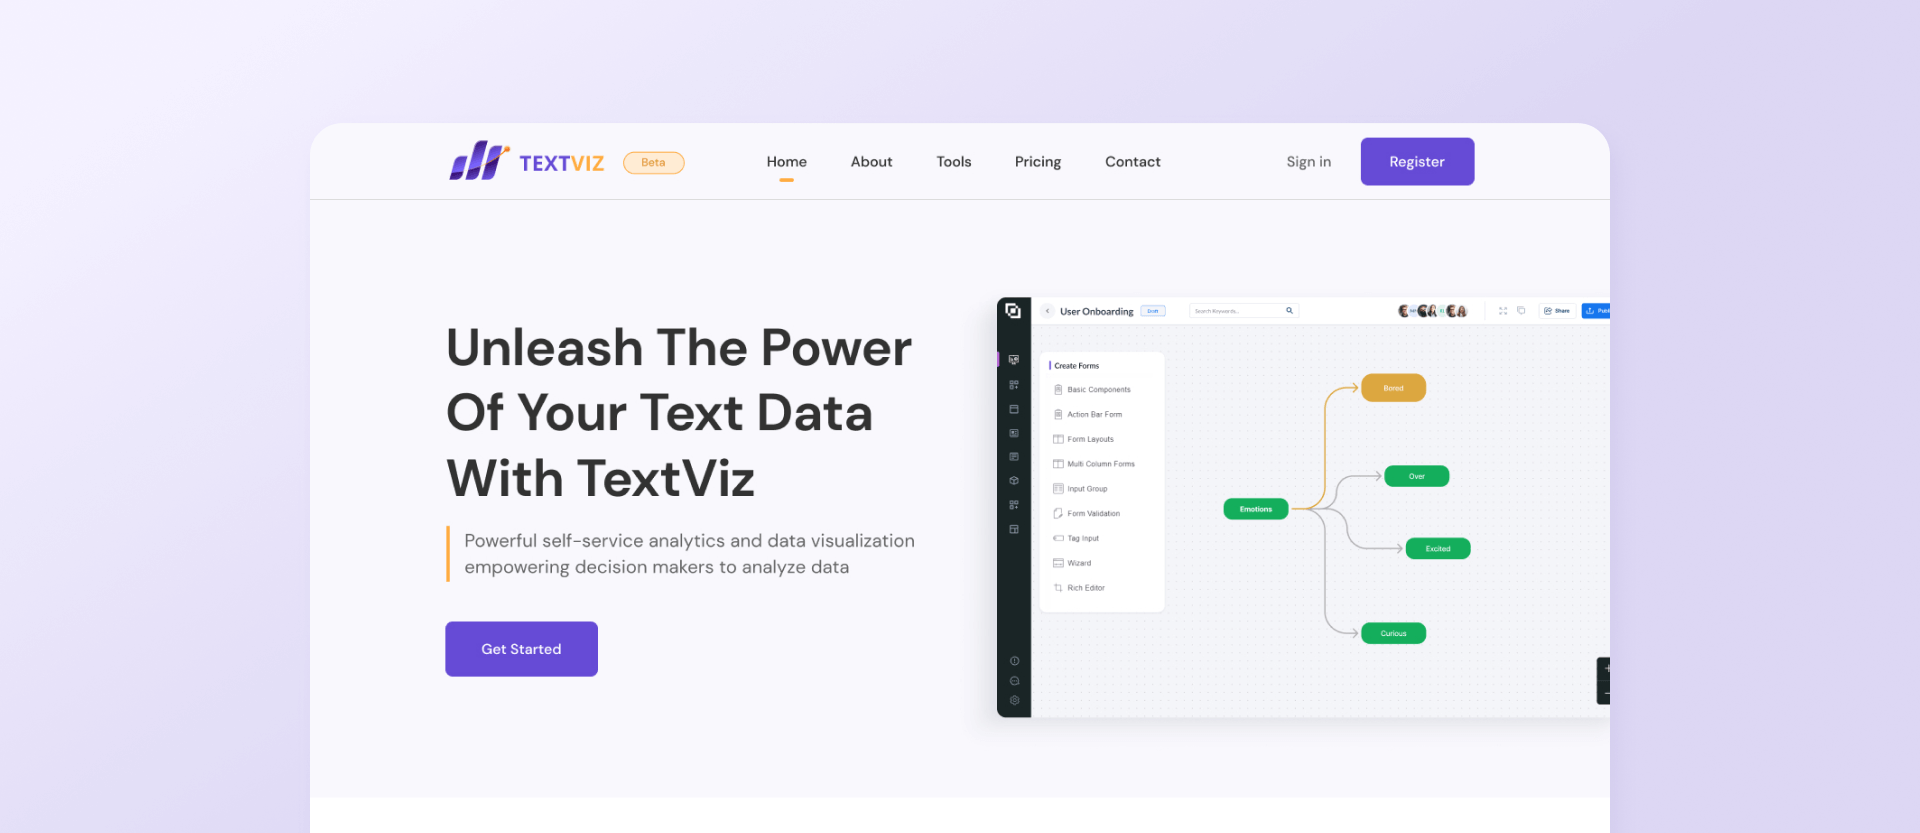
TextViz Landing Page: A landing page that introduces TxtViz and its value proposition, features, and benefits, and invites users to get started or signin.
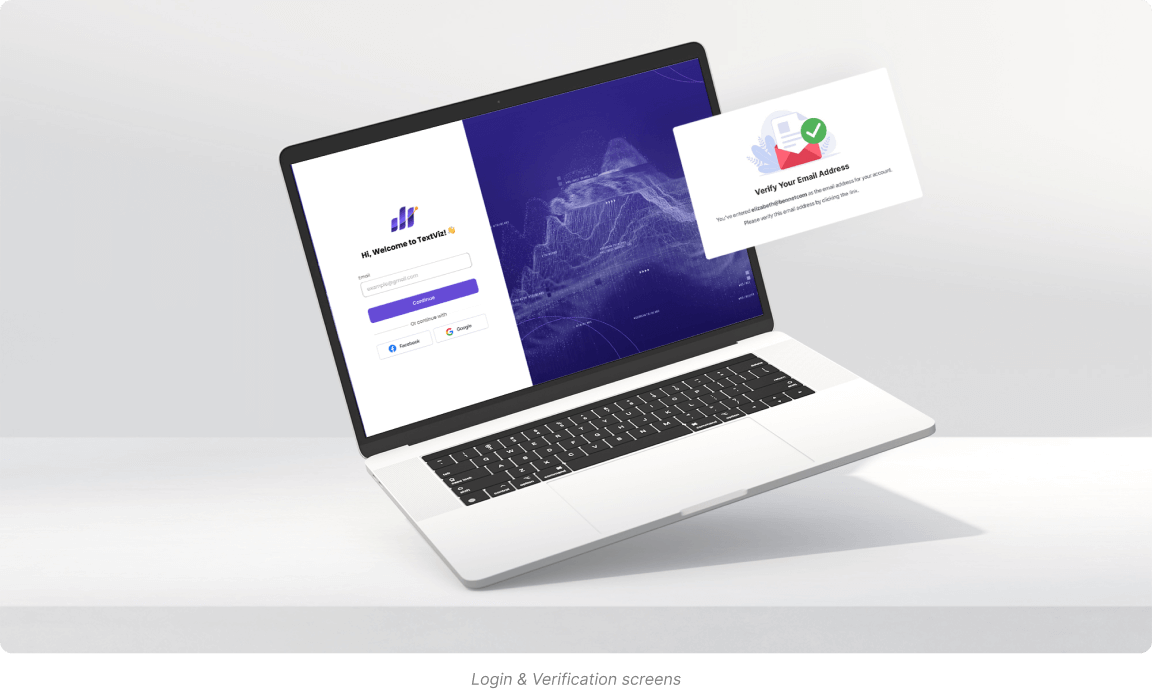
Sign in & Verification: The users can register and login through main landing page with a simple verification process.
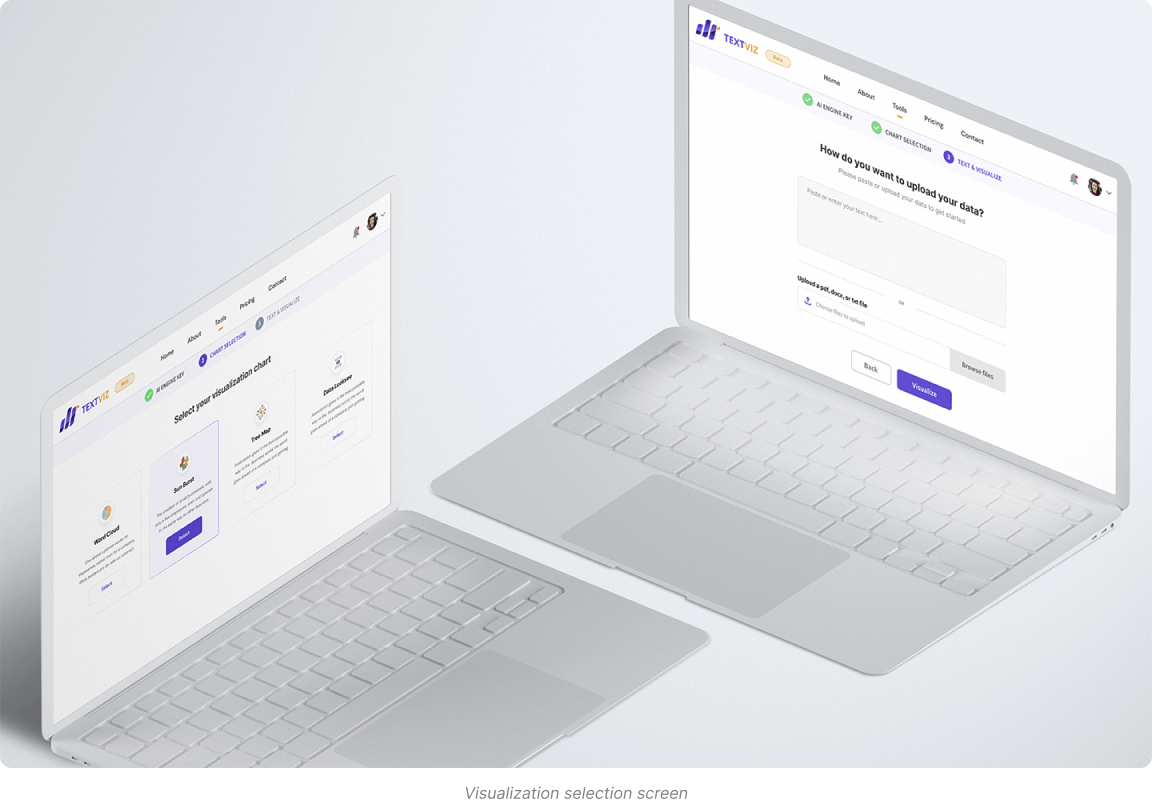
Data Visualization: A process of data upload that allows users to paste or upload their text data, and choose from various NLP models and visualization charts.
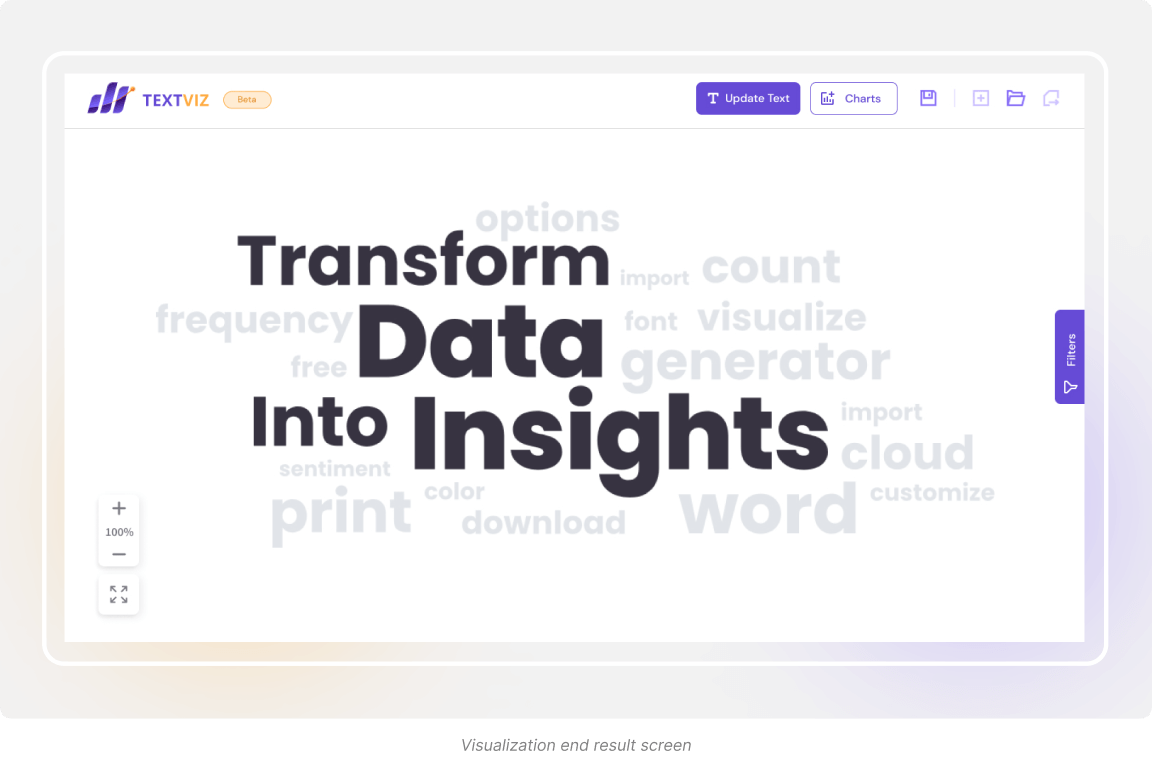
Visualization Result: This shows the results of the text data analysis and visualization, and allows users to interact with and explore the data visualizations. It also allows users to export their results in PDF format, and share or present them with others
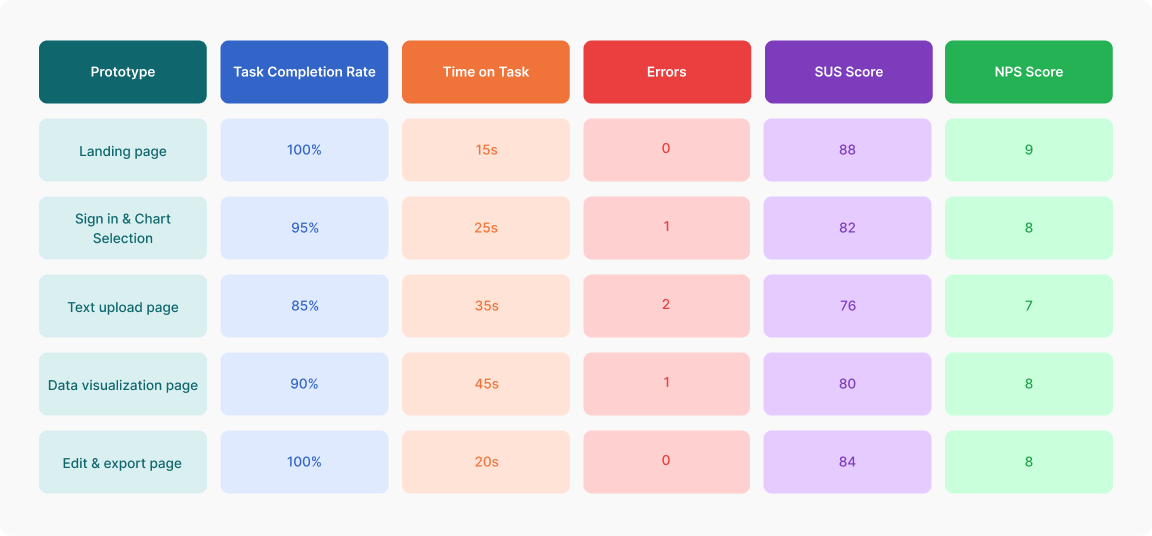
User testing was conducted by a team of UX researchers, who recruited and selected a sample of users who matched the target persona and profile of TextViz. The user testing involved the following steps:
Before the test: We explained the study to users, got their consent, and collected some background info (age, job, etc.) through a questionnaire.
The Test: Users tried out prototypes by creating projects, uploading data, choosing analysis tools, and exploring results. They were encouraged to think aloud while performing tasks. Researchers observed their behavior and recorded things like time spent and clicks.
After the test: Users filled out a survey to gauge their satisfaction with the prototypes. This included standard usability scales and open-ended questions for feedback and suggestions.
Based on the results and feedback from the heuristic evaluation and user testing, some of the possible improvements and recommendations for TextViz include:
Making the “Get Started” button more prominent and visible, and the sign in and register options more accessible and intuitive on the landing page
Providing more information and validation for the OpenAI API key, the NLP models, and the visualization charts, such as descriptions, examples, or error messages on the data upload page
Providing more feedback and explanation for the results, such as labels, legends, or annotations on the data visualization page
Providing more options and customization for the users, such as preview, edit, or download options on the data export page
The design of TextViz involved some learnings and insights, such as:
Text data analysis and visualization is a complex and challenging domain that requires a lot of expertise and skills, but also a lot of potential and opportunities
AI and NLP are powerful and innovative technologies that can enhance and transform the text data analysis and visualization process and outcomes, but also require a lot of trust and transparency
Users have different needs, preferences, and expectations for text data analysis and visualization, and it is important to understand and empathize with them, and to involve them in the design process